Monitor statuses explained
WebsitePulse.io uses several statuses to give you an accurate picture of what's happening with your site — not just up or down. Here's what each one means and how we handle it.
Down
Your site is marked as down when:
- Server error (HTTP 5xx) — your server returns a 500, 502, 504, or similar server-side error code.
- Connection timeout — your site does not respond within 10 seconds.
- Other client errors (HTTP 4xx) — responses like 401 (unauthorised) or 404 (not found) are treated as down, since these indicate the page genuinely cannot be accessed.
When your site goes down, you will receive an alert immediately. You will receive a follow-up alert as soon as it comes back up.
Slow
If your site responds successfully but takes longer than 1.5 seconds, it is marked as slow rather than down. This shows as an amber indicator on your dashboard. You can optionally treat slow responses as down in your monitor settings.
SSL warning
An SSL warning means your site is responding and accessible, but there is a problem with its SSL certificate. Common causes include:
- An expired certificate
- A certificate that does not match the domain name
- An incomplete certificate chain (missing intermediate certificates)
Because the site is still loading, we do not count this as down or send a down alert. Instead, a warning banner appears on your monitor's detail page in the dashboard explaining what we found. Visitors using modern browsers may see a security warning, so it is worth fixing promptly.
Blocked
A blocked status means your site is up and running, but it is actively rejecting automated requests. This typically shows as an HTTP 400 or 403 response. Sites like Facebook, for example, return 400 errors for non-browser traffic as an anti-bot measure.
Because the site itself is clearly operational, we do not treat this as down or send an alert. A warning banner appears in your dashboard. If you believe this is affecting your monitoring accuracy, email us at support@websitepulse.io and we can look at options.
Automatic check frequency reduction (rate limiting)
Some sites respond with an HTTP 429 ("Too Many Requests") status, which means they are asking us to back off. When this happens, we automatically reduce the check frequency for that monitor — typically from every 1 or 5 minutes to a longer interval — to avoid overwhelming the site.
A warning banner in your dashboard will tell you that the check frequency has been reduced and show the new interval. No alert is sent for a 429 response itself, since it does not mean your site is down.
Optional down conditions
These can be turned on per monitor in the monitor settings. Click the settings cog next to any monitor on your dashboard.
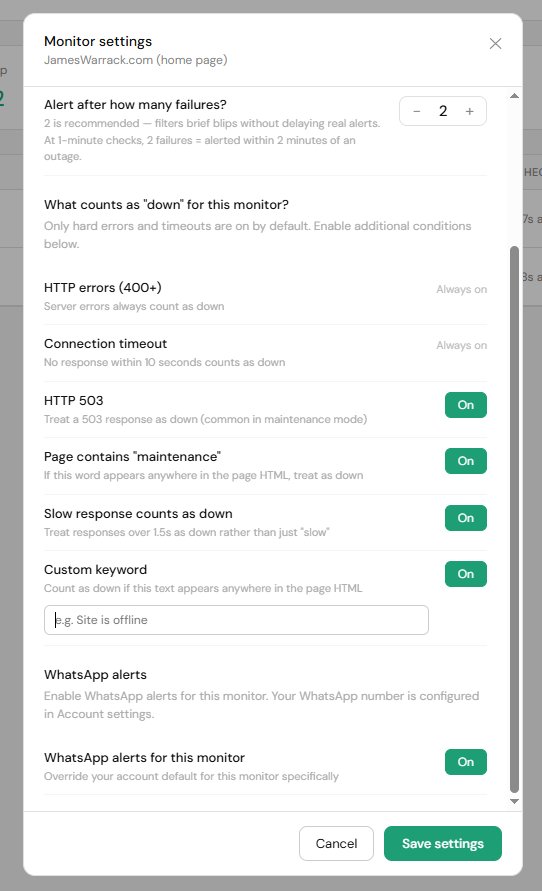
- HTTP 503 — treats a 503 response as down. Useful if your site serves a maintenance page with a 503 status code.
- Page contains "maintenance" — if the word "maintenance" appears anywhere in your page HTML, the site is marked as down. Useful for WordPress maintenance plugins that return a 200 status.
- Slow response counts as down — treats responses over 1.5 seconds as down rather than just slow.
- Custom keyword — you choose a word or phrase. If it appears anywhere in the page HTML, the site is marked as down.